This post summarizes my analysis of the final examination results (Madhyamik Examination) published by the Tripura Board of Secondary Education (called TBSE here on). This work is hugely inspired by that of Deedy’s. Big shoutout to him!
Before you read on: I appeared in the Madhyamik Examination in the year 2015, and hence it is possible that personal biases crept in while writing this essay. So, feel free to point them out if you notice any. There is also a high probability of me rambling, you have been warned!.
The Examination: Madhyamik exam is taken as the final exam during your Class 10. In 2018, the exam was held from 6th March to 20th March, with the results published on 12th June. A total of $45,846$ students ($22,225$ Male & $23,621$ Female) took the exam, which is a 7.15% decrease from that in 2017. So far so good…
If you wish, read up more on the summary of the exam and the statistics here.
The final results: I scraped the final results using Python and BeautifulSoup from the result site. Scraping the results was easy since no extra information other than roll number was required. I just had to increment the roll numbers one by one. So much for privacy! (They now require more information, I think.)
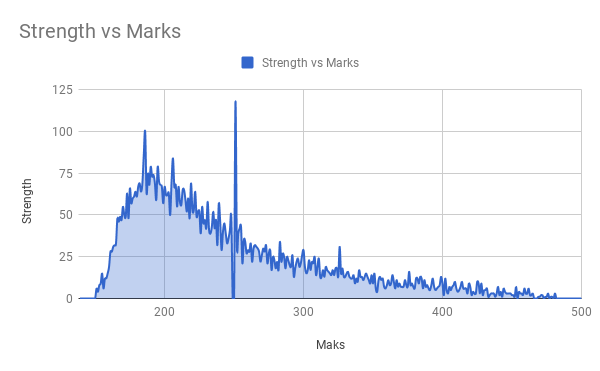
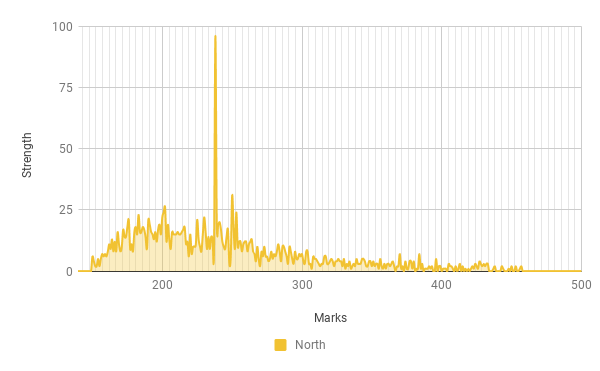
This chart is funny to me. You can clearly see that the marks are not normally distributed, as the marks of most standardised tests are. You can probably straightaway tell that there’s a peak somewehere around $250$, and that number of students decreased towards the higher-mark spectrum. Now this is where things start to get interesting for me. Let us look at the district-wise breakdown.
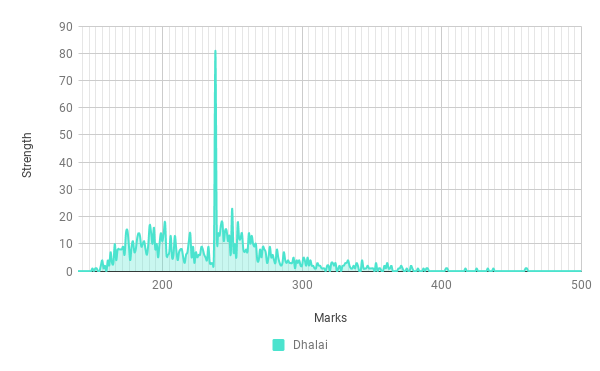
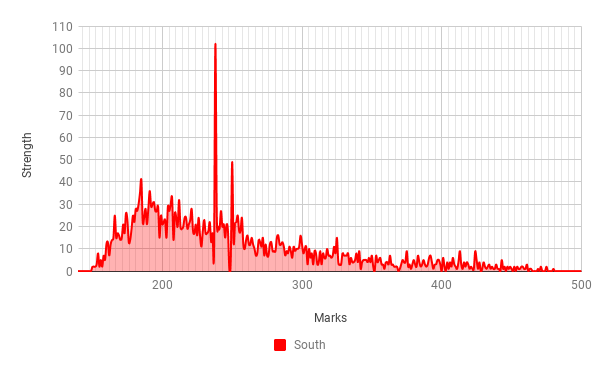
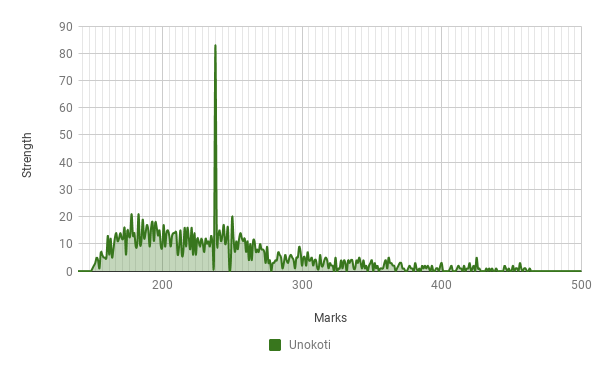
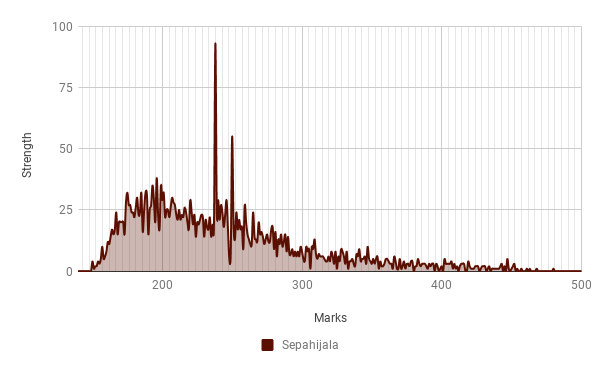
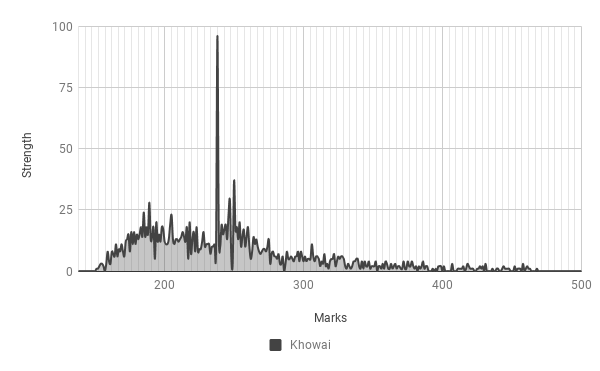
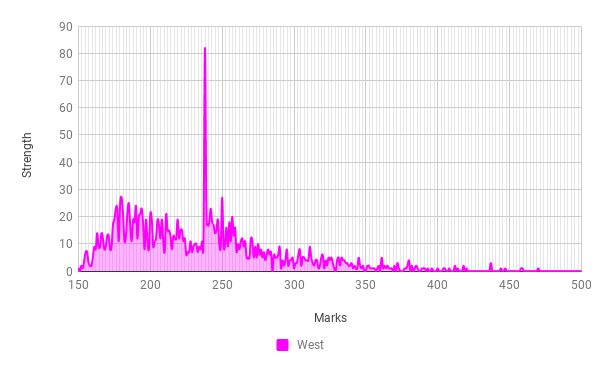
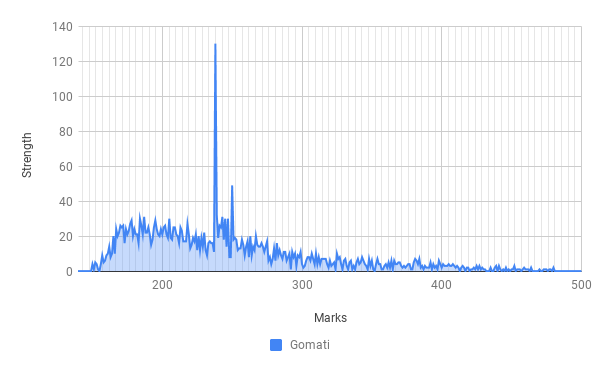
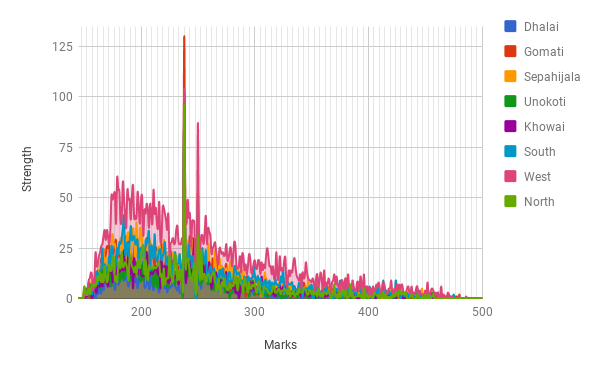
Assuming that you’ve looked at the charts, you see that odd peak somewhere midway between $200$ and $300$ in every graph. If you are disappointed with it, well you are not alone. Not a single district follows the “ideal distribution” of marks. I’ll tell you that the peak that you see is $238$. $844$ students got $238$ marks.
Summary and concluding remarks
I saw the overall statistics of the exam result, then the district-wise break down of the marks distribution and how much they deviated from the ideal trend. A whopping $844$ students got $238$ marks. The district I come from, Dhalai had a pass percentage of only 35.7%. I wish to change that. Some day.
Comments from a 24-year-old Reang, 9 years after his Class 10 exam result
Some grace marks are probably fine – someone might have had a bad day, perhaps someone forgot to add a few numbers, etc. The problem is that most schools look at Class 10 results for admission to Class 11. It does not serve the interest of the students if they pass Class 10, but cannot enrol themselves in Class 11. Younger me used to think that making them repeat another year would solve this problem. I was so wrong!
It is a bit pointless to hype up a basic exam such as the one you take when you are 15 or 16 years old, firstly. Secondly, making students repeat Class 10 still does not solve the core issue of lack of supply of quality schools – there simply aren’t enough decent schools in Tripura where students can take admission after Class 10 (this is true irrespective of how you did in your 10th board exam).
Increasing the number of good schools is one way to solve for the problem. Let’s say that some children did not wish to study in Class 10, doing whatever else they were doing. As a society, I think it is our collective responsibility to give them multiple shots at a decent life, and not wreck havoc in their lives because they screwed up in a pointless school level exam.
Comments, reactions, and suggestions are welcome.
Let's be friends
You can buy me a coffee. Just click on the cup on your screen.
You can also buy me a book instead.
Newsletter
Subscribe to receive an update as soon as I write something new.
For suggestions, corrections etc. please send me an email. You can also send me an anonymous comment.